

On Monday, I wrote about how to get more traffic to your site. There are many ways to do this, but once you get traffic, how do you know what to do with that? Using Google Analytics is a great tool for tracking how many visitors are coming to your site, but it can be overwhelming for a new user, with lots of data that you don’t know what to do with.
So I thought I’d take a few minutes and explain a few basic things you should know when reviewing your analytics in Google.
When you first land in Analytics, you’re going to get a basic Dashboard with your Audience Overview. It’ll show you some basic stats for your site for the last month. But what do you make of this information?
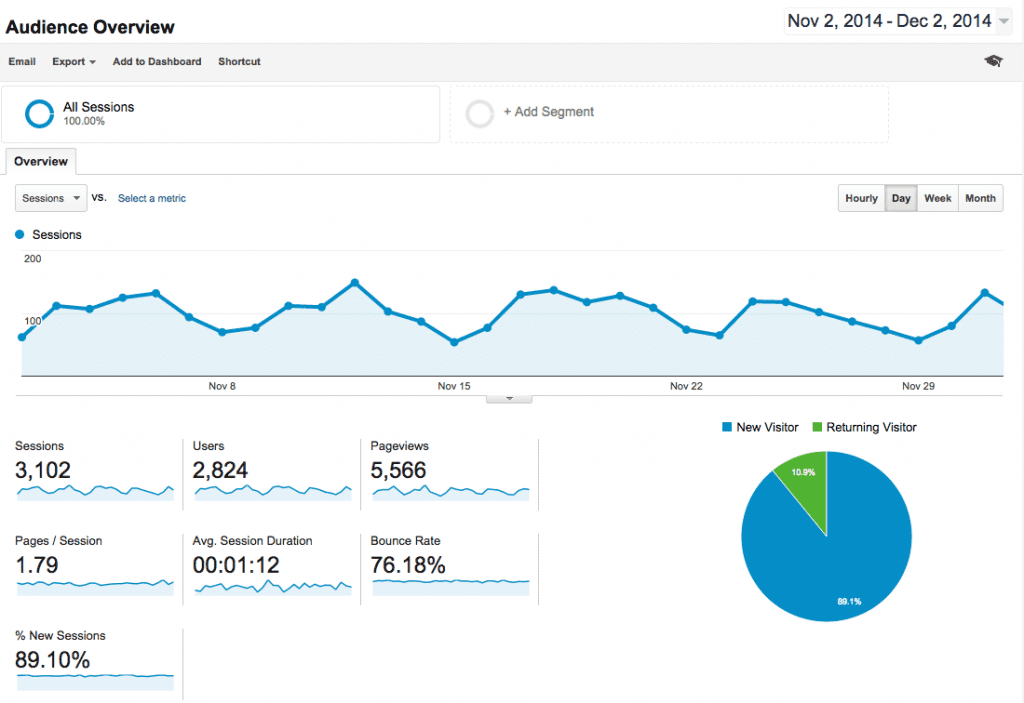
Let’s start with your Sessions. That’s the line graph you see with dots. Each dot represents how many sessions you had each day, and then the first box for sessions tells you how many sessions you’ve had for the month or for whatever time frame you’ve chosen. But what is a session? Great question!
A Session is a group of interactions that take place on your site within a certain time frame from a single user. A session isn’t how many users, because a user can initiate more than one session. Say a user lands on your site, and they spend 20 minutes looking around, visiting various pages. That is one session. If they come back the next day and do it again, that’s another session. But it’s still only one user.
Users is the number of unique users your site has had.
Pageviews is the total number of pages that users looked at on your site.
Pages/Session is the average number of pages that were viewed during each session.
Average Session Duration is the average amount of time a user spent on your site during their session.
Bounce Rate is the number of users who left your site after visiting only one page.
% of New Sessions are the number of sessions initiated by someone who had never previously visited your site.
Obviously, there’s much more data in your Google Analytics account than this, and there’s a ton more you can do with your Analytics once you learn the ropes, but for today, I want to stick with the basics of these metrics. There’s a lot of data that can be gathered from just this information. If you look at this example, you can see that users aren’t spending a lot of time on this particular site as they are looking at an average of less than two pages and just over a minute in time and that the majority of visitors are leaving after seeing just one page. There are a lot of ways to interpret this data, but we’d need to dive further into everything Google analytics has to offer to really understand what this means.
Got Analytics questions? We have answers! Contact us today for help!

Amy Masson
Amy is the co-owner, developer, and website strategist for Sumy Designs. She's been making websites with WordPress since 2006 and is passionate about making sure websites are as functional as they are beautiful.